top of page
GARRICK TAYLOR BYRNE
SPOTIFY PROJECT
The goal of this project was to use the professor's listening history to recommend three new songs that he might like.
The professor supplied students with two files documenting his musical tastes: his iTunes listening history and a log from YouTube.
The treemap below is an an initial look at the listener's listening history. Within the data provided most songs were tagged with their genre, but many were not.

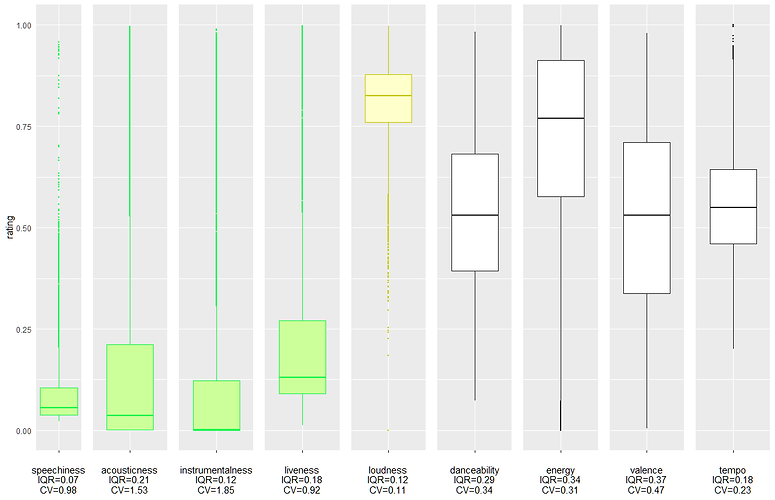
Spotify has ranked the songs in its library on eight musical characteristcs, and further provides data about the song's key and tempo. Spotify provides an API by which users can retrieve a track's musical characteristics. The boxplots below show the professor's preferences per Spotify's acoustic categories.
The professor has distinct preferences regarding speechiness, acousticness, instrumentalness, and liveness. Within these categories, there is a relatively small interquartile range and a high coefficient of variation. The professor also has a preference for loudness.
Regarding danceability, energy, valence, and tempo, the listener is less particular: the IQR is large, and the range between the data set maximum and minimum is large (excluding outliers).
Another way to visualize this information is with a density plot.
Notice how the four principal variables of interest are narrowly distributed, while danceability, energy, valence, and tempo are broadly distributed.
When querying Spotify for recommendations, I specified the listener's upper and lower IQR values for speechiness, acousticness, instrumentalness, and liveness as parameters.

I queried Spotify for three songs based on the listener's preferences. Here is one example of Spotify's recommendations.

bottom of page